How Advanced Pilots Map Orchard Tree Height with a 100m Grid
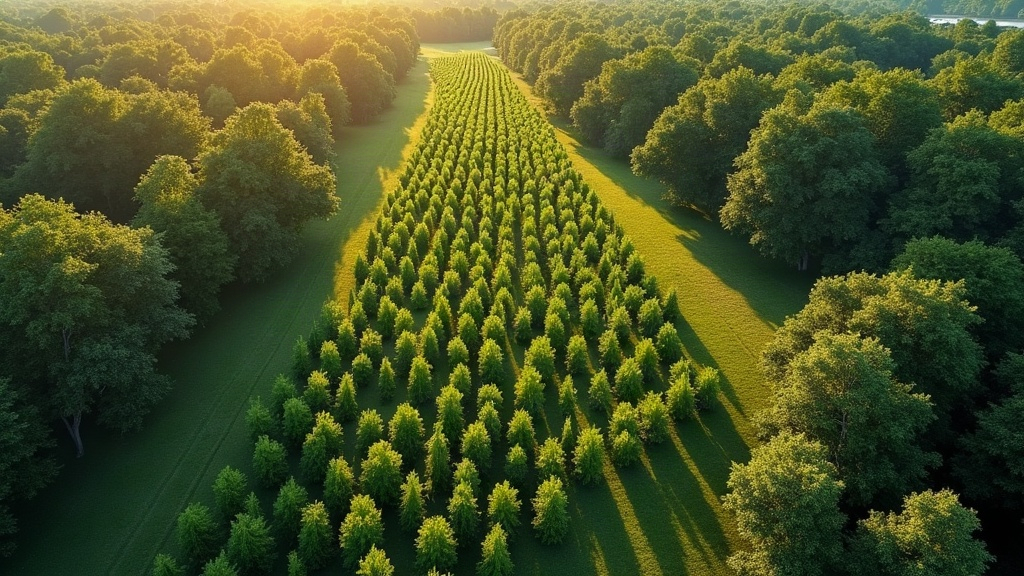
Mapping orchard tree height with a 100m photogrammetry grid is one of the go-to techniques advanced drone pilots lean on when they need an accurate canopy height model for a commercial orchard. It’s not a single trick but a combination: structured flight planning, high image overlap, and solid ground control, all working together to produce elevation data precise enough to guide spraying decisions, pruning schedules, and yield forecasts.
Why Tree Height Mapping Matters
Orchard managers don’t chase canopy height data out of curiosity. It feeds directly into decisions that cost (or save) real money:
- Variable-rate spraying - a row of mature, 4-meter canopies needs a different nozzle angle and chemical volume than a block of young trees still filling in.
- Pruning schedules - height trends tracked over several seasons expose growth irregularities between blocks that you’d never catch walking the rows.
- Yield estimation - in many orchard crops, canopy volume tracks closely with fruit load, so height data becomes a decent proxy for tonnage.
- Irrigation zoning - uneven height across a block is often the first visible sign of water stress or a soil change you didn’t know was there.
Skip the systematic aerial survey and you’re left guessing, or worse, sending someone to walk transects with a measuring pole for three days.
What a 100m Grid Actually Means
Here’s where people get confused: a “100m grid” describes the spacing of flight lines and the ground resolution of the survey, not how high the drone is flying. Pilots usually fly at 60-80m AGL (altitude above ground level), depending on local rules and the sensor on board, but the mission itself is structured so that:
- Flight lines overlap at 70-80% front overlap and 60-70% side overlap.
- The resulting orthomosaic and digital surface model (DSM) land at a ground sampling distance (GSD) of 2-4cm, tight enough to resolve the tops of individual canopies.
- The orchard is broken into standardized blocks of roughly 100m x 100m, so every zone can be compared on equal footing.
This grid logic matters because it guarantees even photographic coverage everywhere, not just in the easy-to-fly middle of the field. Without it, you end up with a canopy height model (CHM) that’s crisp in some blocks and mushy in others.
Step-by-Step Workflow
1. Pre-Flight Planning
Most pilots sketch the mission in Pix4Dcapture, DJI Terra, or Litchi, matching the grid boundary to the actual orchard parcel (not a rough rectangle around it). A few settings make or break the result:
- Altitude locked so GSD stays consistent across the whole flight, not drifting as the drone climbs over a hill
- A double grid pattern (crosshatch) for better 3D reconstruction along canopy edges
- RTK or PPK-enabled drones where possible, which cuts down (though doesn’t eliminate) the need for extensive ground control points
2. Ground Control Points
Even on an RTK drone, dropping 4-6 GCPs around the orchard perimeter tightens up vertical accuracy noticeably. Height data is unusually sensitive to elevation drift, and GCPs anchor the whole model to true geodetic height. That matters a lot when you’re comparing canopy height across three or four flights spread over a growing season, not just one snapshot in time.
3. Flying the Grid
A double-grid flight captures both nadir shots (straight down) and slightly oblique ones. The oblique angle is what actually photographs the sides of the canopy, not just the flat top. Skip this and you’ll see the classic “flat top” error that plagues single-pass nadir flights, where the model essentially treats every tree as a cylinder with a pancake on top.
4. Processing the Height Model
Inside Pix4Dfields or Agisoft Metashape, the pilot builds three layers:
- A Digital Terrain Model (DTM), the bare ground between the rows
- A Digital Surface Model (DSM), the top of the canopy itself
- A Canopy Height Model (CHM), which is simply DSM minus DTM, isolating the actual tree height
This is where the 100m grid earns its keep. Because image density stays uniform across the orchard, the DTM-DSM subtraction holds up block to block, not just in the sections that happened to get extra photo coverage.
Common Pitfalls to Avoid
- Flying too fast - drop the speed too low in the overlap-altitude tradeoff and motion blur softens canopy edges, which quietly wrecks reconstruction accuracy.
- Ignoring wind - trees swaying between shots is one of the most underrated sources of error in orchard mapping.
- Skipping GCPs - even a well-calibrated RTK system benefits from a handful of verified control points, if only for QA.
- Inconsistent timing - midday light, with shadows pulled in tight under the canopy, beats the long shadows of early morning or late afternoon for minimizing occlusion.
Real-World Application
Take a 50-hectare apple orchard surveyed this way: the resulting CHM typically comes in with sub-10cm vertical accuracy, tight enough to spot pruning inconsistencies between rows that were planted the same season and should look nearly identical. Many growers then stack this height data on top of NDVI maps, cross-referencing height anomalies against vigor readings to get a fuller read on orchard health, catching problems that neither dataset would reveal on its own.
Conclusion
Mapping orchard tree height with a 100m photogrammetry grid isn’t a gimmick; it’s a repeatable method that turns a stack of aerial photos into genuinely useful canopy data. Get the grid spacing right, keep overlap high, shoot obliques alongside nadir shots, and anchor everything with solid ground control, and you end up with the kind of precision that modern orchard management is starting to treat as standard practice, not a luxury.